When traders look at a stock, futures contract, or cryptocurrency chart, they often face an overwhelming number of technical indicators.
Moving averages, oscillators, momentum indicators, volume studies—there is no shortage of tools. The real challenge is knowing which signals actually matter.
This is where Dr. Alexander Elder stands out.
A psychiatrist by training and a trader and trading educator by profession, Elder became well known for combining technical analysis, trading psychology, and money management into a single framework.
One of his best-known contributions is the Elder-Ray Indicator, a technical tool designed to examine the strength of buyers and sellers around a moving-average-based measure of value.
His broader approach also includes the Triple Screen Trading System and the famous 3M framework: Mind, Method, and Money.
Who Is Alexander Elder?
Alexander Elder was born in Estonia, then part of the Soviet Union. He studied medicine at a remarkably young age and eventually worked as a ship's doctor.
During a voyage in Africa, he left the Soviet system and sought political asylum at the U.S. embassy in Abidjan, Côte d'Ivoire. He later moved to the United States, obtained his medical credentials, and established himself as a psychiatrist in New York.
His medical career gave him something that would later become central to his trading philosophy: a deep interest in human behavior and psychology.
Elder eventually became fascinated by financial markets. Rather than viewing charts simply as collections of price patterns, he saw markets as places where fear, greed, hope, and other emotions interact on a massive scale.
That perspective became the foundation of his approach to trading.
He later became a professional trader, author, and trading educator, sharing his methods through books, seminars, and educational programs.
His best-known books include:
- Trading for a Living
- Come Into My Trading Room
- The New Trading for a Living
- Entries & Exits
Why Trading Psychology Matters to Alexander Elder
Elder's background as a psychiatrist strongly influenced the way he approached financial markets.
A chart does not move because of a line or indicator on a screen. It moves because market participants place orders based on expectations, information, fear, greed, and uncertainty.
From this perspective, technical analysis can be viewed as a way of interpreting the behavior of market participants.
This is also why Elder places such a strong emphasis on discipline and emotional control.
A trader may have an excellent strategy, but if fear causes premature exits or greed leads to excessive position sizes, the strategy can still fail.
For Elder, successful trading requires more than finding good entry signals. It requires controlling the trader behind the screen.
What Is the Elder-Ray Indicator?
The Elder-Ray Indicator is one of Alexander Elder's most recognizable contributions to technical analysis.
The concept is relatively straightforward.
Elder-Ray combines:
1. 13-period Exponential Moving Average (13 EMA)
2. Bull Power
3. Bear Power
The goal is to examine the relationship between the current market price and the moving average while estimating the strength of buying and selling pressure.
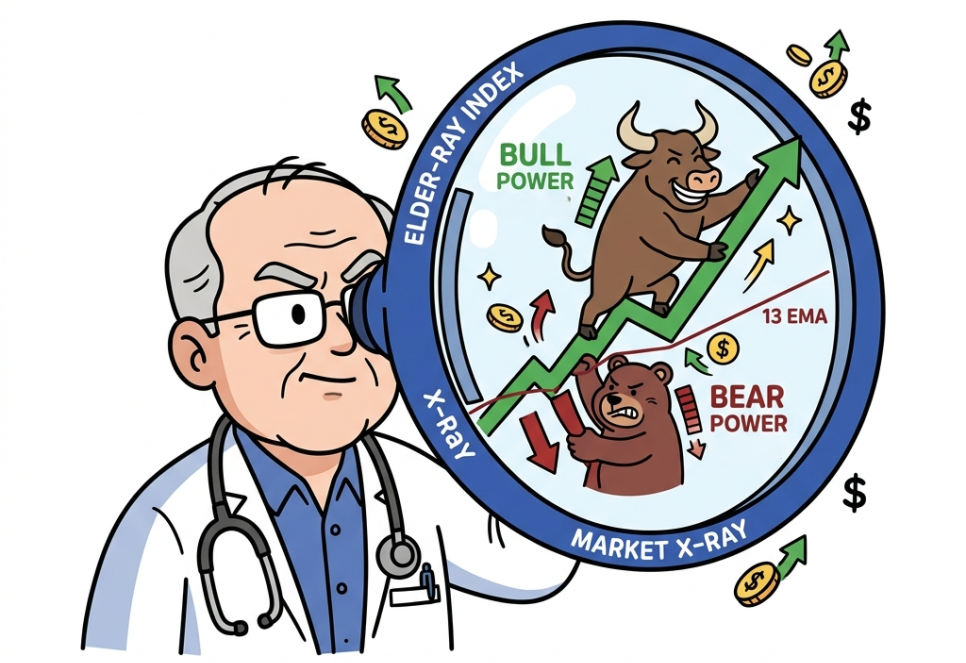
The name "Elder-Ray" is associated with the idea of an X-ray: looking beneath the visible price movement to examine the forces driving the market.
13 EMA: The Market's Reference Point
The 13-period EMA serves as the central reference point in the Elder-Ray system.
Because an exponential moving average gives greater weight to recent prices, it reacts more quickly to changes in market conditions than a simple moving average.
In Elder's framework, the EMA represents a rough measure of the market's current consensus about value.
The slope of the EMA is particularly important.
- Rising 13 EMA → bullish trend bias
- Falling 13 EMA → bearish trend bias
The EMA itself does not predict the future. Instead, it helps establish the broader trend in which the Bull Power and Bear Power signals should be interpreted.
Bull Power
The basic formula is:
Bull Power = High − 13 EMA
Bull Power measures how far the day's high extends above the 13 EMA.
A stronger positive reading suggests that buyers were able to push prices substantially above the market's reference level.
However, the absolute value is not the only thing that matters. Traders often examine whether Bull Power is strengthening or weakening over time.
Bear Power
The formula is:
Bear Power = Low − 13 EMA
Because the low is often below the EMA, Bear Power will frequently have a negative value.
A more negative reading indicates that sellers were able to push prices farther below the reference level.
Again, the trend in the indicator can be more informative than a single reading.
Elder-Ray at a Glance
| 13 EMA | Exponential moving average | Trend and reference value |
| Bull Power | High − 13 EMA | Strength of buyers above the EMA |
| Bear Power | Low − 13 EMA | Strength of sellers below the EMA |
Together, these components provide a framework for viewing trend + buying pressure + selling pressure.
How to Use the Elder-Ray Indicator
One of Elder's central ideas is to trade in the direction of the primary trend rather than fighting it.
For example, a trader looking for long opportunities would generally want the 13 EMA to be rising.
A potential bullish setup may involve:
- The 13 EMA trending upward
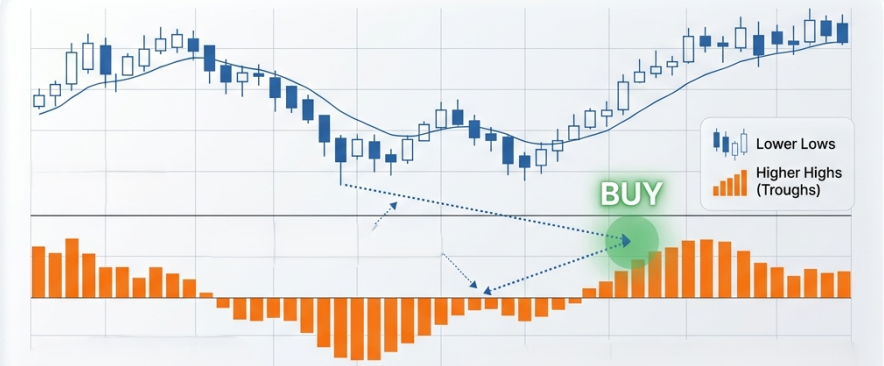
- Bear Power below zero
- Bear Power forming a higher low compared with a previous low
- Evidence that selling pressure is beginning to weaken
The logic is important.
Instead of buying simply because the market has fallen, the trader waits for a temporary decline within a broader uptrend and looks for evidence that sellers are losing strength.
Potential Short or Exit Setup
For bearish conditions, the framework can be reversed:
- The 13 EMA is declining
- Bull Power is above zero
- Bull Power forms a lower high
- Buying pressure begins to weaken
This can help identify situations where a temporary rally occurs within a broader downtrend.
These are technical analysis guidelines rather than guaranteed trading signals. Market conditions can produce false signals, particularly when prices move sideways.
Elder-Ray and Divergence
One of the more interesting applications of Elder-Ray is divergence.
Suppose the price makes a new low, but Bear Power makes a higher low.
This may indicate that selling pressure is becoming weaker even though the price itself has declined.
Likewise, if the price reaches a new high while Bull Power forms a lower high, buying pressure may be losing momentum.
Divergence should not automatically be treated as a reversal signal.
Instead, it can be used as an early warning that the existing trend may be losing strength.
The Triple Screen Trading System
Alexander Elder is also known for the Triple Screen Trading System.
The basic idea is to avoid making a trading decision based on a single timeframe or indicator.
Instead, the trader examines the market from multiple time horizons.
Screen 1: Identify the Primary Trend
The first screen looks at a higher timeframe.
For example, a trader working primarily with daily charts may first examine the weekly chart.
The objective is to determine the dominant market direction.
If the larger trend is bullish, the trader focuses primarily on long opportunities. If the larger trend is bearish, short opportunities receive greater attention.
Screen 2: Find the Countertrend Move
The second screen looks for a temporary move against the primary trend.
In an uptrend, this could be a short-term decline.
In a downtrend, it could be a temporary rally.
Oscillators such as Elder-Ray, RSI, or Stochastic can be used to identify these temporary moves.
The idea is to find a potentially favorable entry during a correction rather than chasing an already extended move.
Screen 3: Time the Entry
The third screen focuses on the actual entry.
Shorter-term price action can be used to determine whether the market is beginning to move in the direction of the primary trend again.
This creates a three-step process:
Primary trend → Countertrend correction → Entry timing
The strength of the system lies in combining multiple pieces of information rather than relying on one indicator.
Alexander Elder's 3M Trading Philosophy
Perhaps the most memorable part of Elder's philosophy is the 3M framework:
1. Mind — Trading Psychology
The first "M" is Mind.
A trader must be able to control fear, greed, impatience, and the desire to recover losses quickly.
Keeping a trading journal and following predetermined rules can help reduce emotionally driven decisions.
2. Method — Trading Strategy
The second "M" is Method.
A trader needs a systematic approach to analyzing the market.
Elder-Ray, the Triple Screen system, moving averages, and other technical tools can form part of such a methodology.
The key is consistency rather than constantly switching strategies whenever market conditions become uncomfortable.
3. Money — Risk Management
The third "M" is Money.
Even a strong trading strategy can fail if position sizing and risk management are poor.
Elder is widely associated with the 2% Rule and 6% Rule, which are designed to prevent a trader from allowing a series of losses to seriously damage trading capital.
The exact risk limits should be adapted to the trader's circumstances, but the underlying principle is simple:
Survival comes before profitability.
Strengths and Limitations of Elder-Ray
The Elder-Ray Indicator has several useful characteristics.
Advantages
- Combines trend and buying/selling pressure
- Helps identify potential corrections within a trend
- Can be used with multiple timeframes
- Provides a structured way to examine divergence
- Fits naturally into Elder's broader trading methodology
Limitations
- Can produce false signals in sideways markets
- Should not be used as a standalone forecasting tool
- Divergence can persist longer than expected
- Different markets and timeframes may produce different results
For these reasons, traders often combine Elder-ray with price action, volume, moving averages, MACD, RSI, or other forms of analysis.
Which Timeframe Should You Use?
There is no universally correct timeframe for Elder-Ray.
A trader's holding period and market should determine the appropriate chart.
Common examples include:
- Swing trading: Daily chart
- Short-term trading: 4-hour chart
- Day trading: 30-minute to 60-minute charts
The important principle is consistency.
If you use multiple timeframes, make sure each timeframe has a clear purpose within your trading plan.
Why Alexander Elder Still Matters
Alexander Elder's influence extends beyond the Elder-Ray Indicator.
His most important contribution may be his insistence that trading is not simply a technical exercise.
A trader needs to understand:
The market → the method → the risk → and the trader's own psychology.
Elder-Ray provides one way to examine the struggle between buyers and sellers.
The Triple Screen system provides a framework for combining multiple time horizons.
And the 3M philosophy reminds traders that even the best technical setup means little if psychology and risk management are ignored.
Final Thoughts

Alexander Elder's approach offers a useful lesson for modern traders.
Rather than searching endlessly for the "perfect" indicator, it can be more productive to build a structured process:
Identify the trend → wait for a correction → examine buying and selling pressure → confirm the setup → control risk.
The Elder-Ray Indicator can be a valuable part of that process, particularly for traders who want to combine trend analysis with market psychology.
But no indicator can eliminate uncertainty from financial markets.
The real lesson behind Elder's work is perhaps not how to predict every market move, but how to stay disciplined, manage risk, and remain in the game long enough to benefit from good opportunities.
This article is for educational and informational purposes only and should not be considered financial advice. Trading stocks, futures, cryptocurrencies, and other financial instruments involves substantial risk, including the potential loss of capital.


